The mySolarEdge user interface has been updated! Read on to learn what’s new in mySolarEdge 2.0.
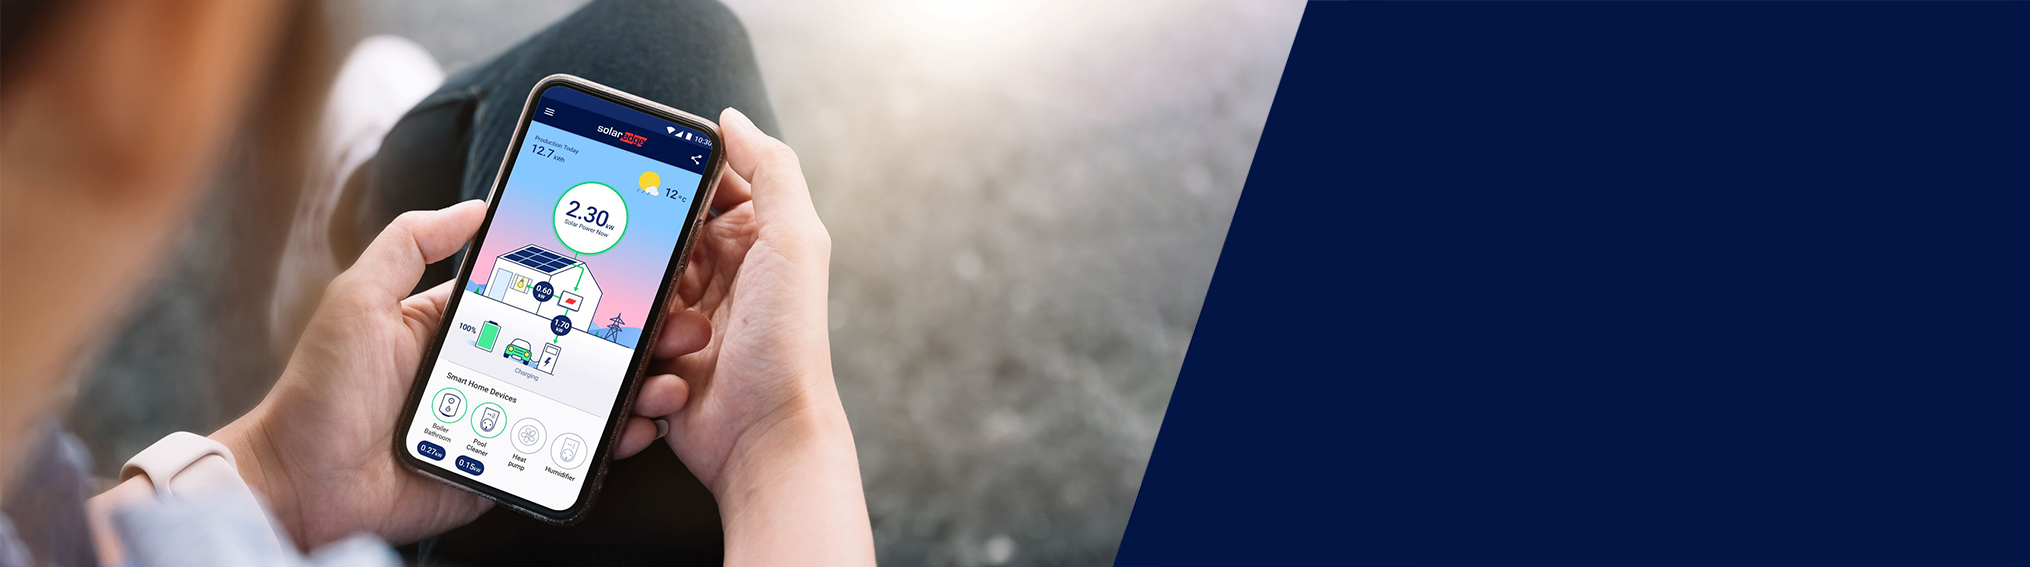
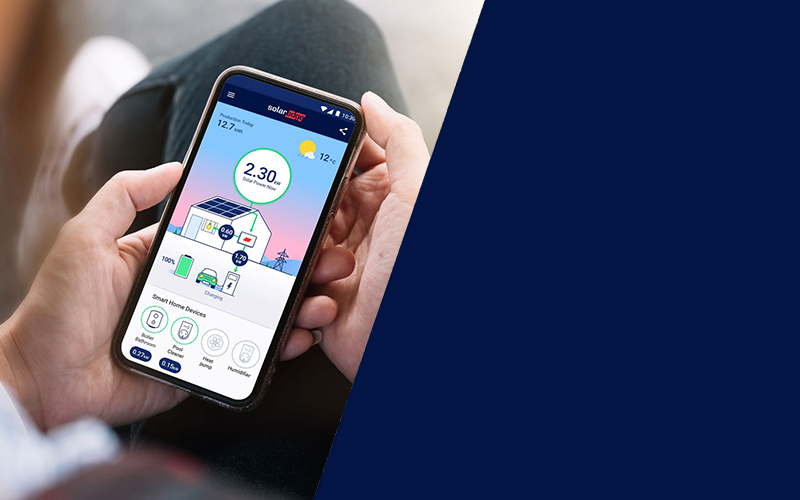
Experience mySolarEdge like never before!
-
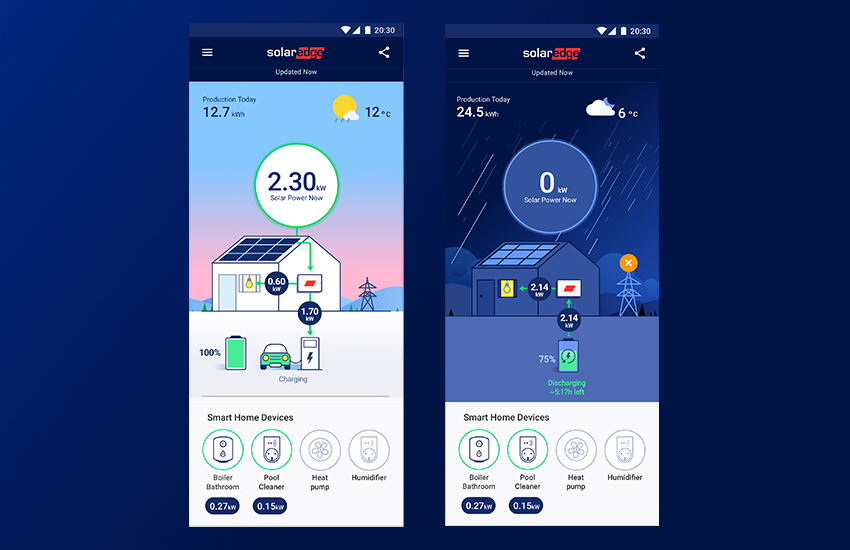
A stunning new dashboard allowing even easier monitoring of your system behavior
-
Revamped household power flow graphic, with an eye-catching design and stylish background that changes according to weather and time of day
-
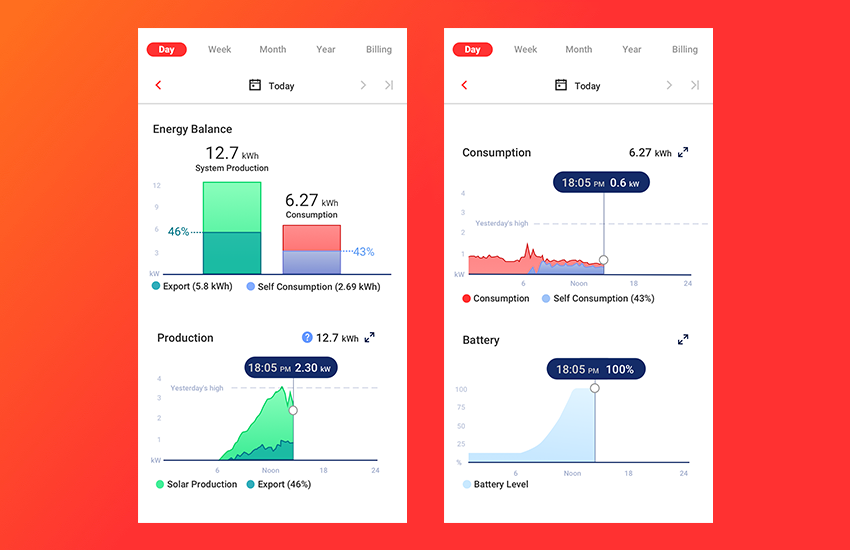
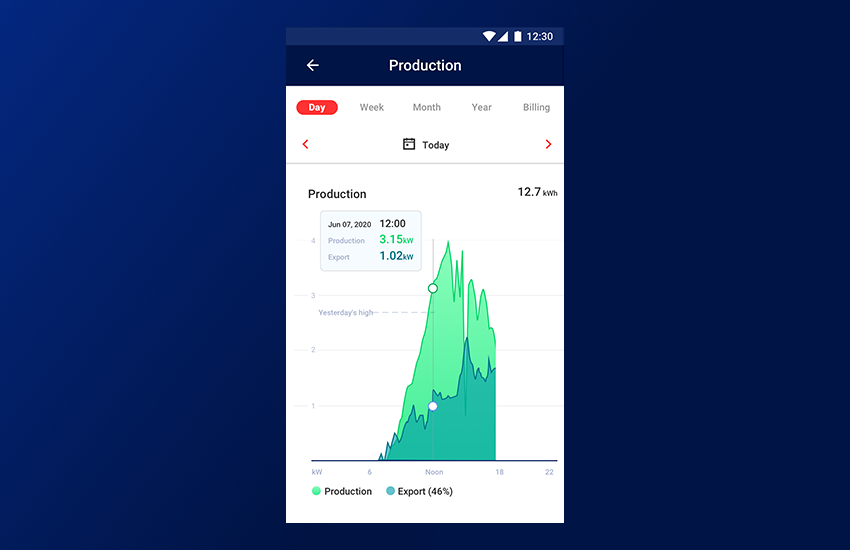
All-new graphs for viewing system production, consumption, export and battery behavior over time
-
We’ve made it easier to view graph values. For example, you can long-press and drag any point along the graph and see the values continuously changing
-
Easily compare today’s performance to previous days e.g. use the graph to compare today’s energy production to yesterday’s maximum production level
-
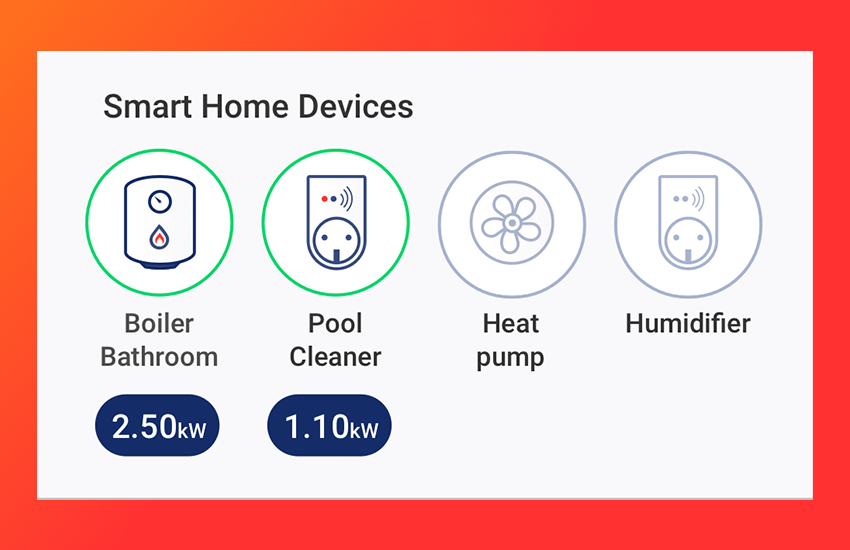
A new smart energy device strip allowing easier device management from the mySolarEdge main dashboard
-
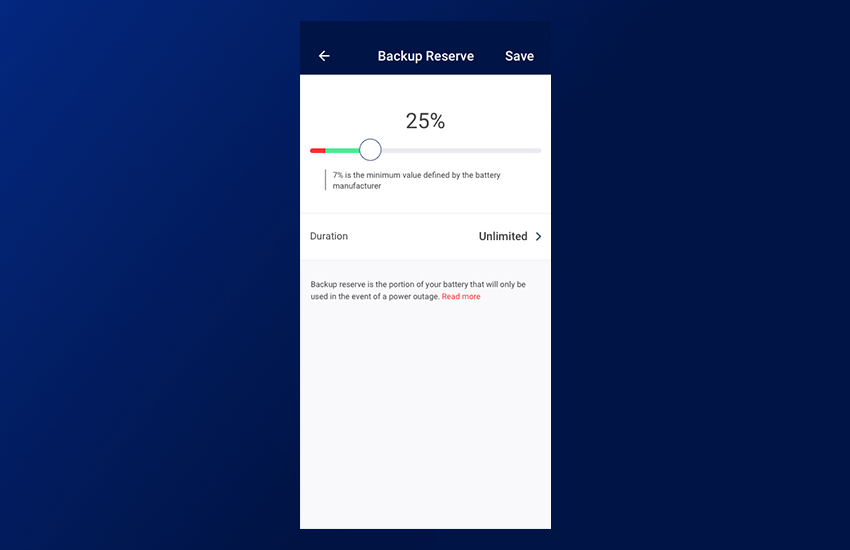
A new backup reserve feature that helps prepare you for possible power outages
* Certain features depend on inverter model, and system permissions assigned by your installer
** A SolarEdge energy meter is required for consumption monitoring
Off